

The name "Prometheus" came from a Greek god of fire believed to be intelligent.
Prometheus as software is an open-source system monitoring and alerting tool used by companies that run microservices applications to monitor, and collect data on their application in real time. Prometheus uses a timestamp, which is called a metric, to record the data collected.
In 2012, developers launched Prometheus on SoundCloud. In 2016, they handed it over to the Cloud Native Computing Foundation (CNCF). ever since it became free software maintained by the organization. It is licensed under Apache 2.0.
This article will cover key features of Prometheus, architecture and compare it with other alternatives.
Key features of Prometheus
Prometheus has a data model that is deemed multi-dimensional because its time-series data is labelled with metric names and key-value pairs.
Prometheus Query Language (PromQL) is a query language that is used to achieve the multi-dimensional nature of the data model.
Prometheus collects time-series data through a pull monitoring model by scraping HTTP endpoints.
It supports the pushing of metrics using the Pushgateway.
It does not depend on a remote storage system.
Also, its single server nodes are independent.
It uses service discovery or static configurations to discover targets.
Finally, it supports a wide range of graphs and dashboards to work with.
Architecture Of Prometheus
Prometheus has components that make up the entire monitoring and storing of time series.
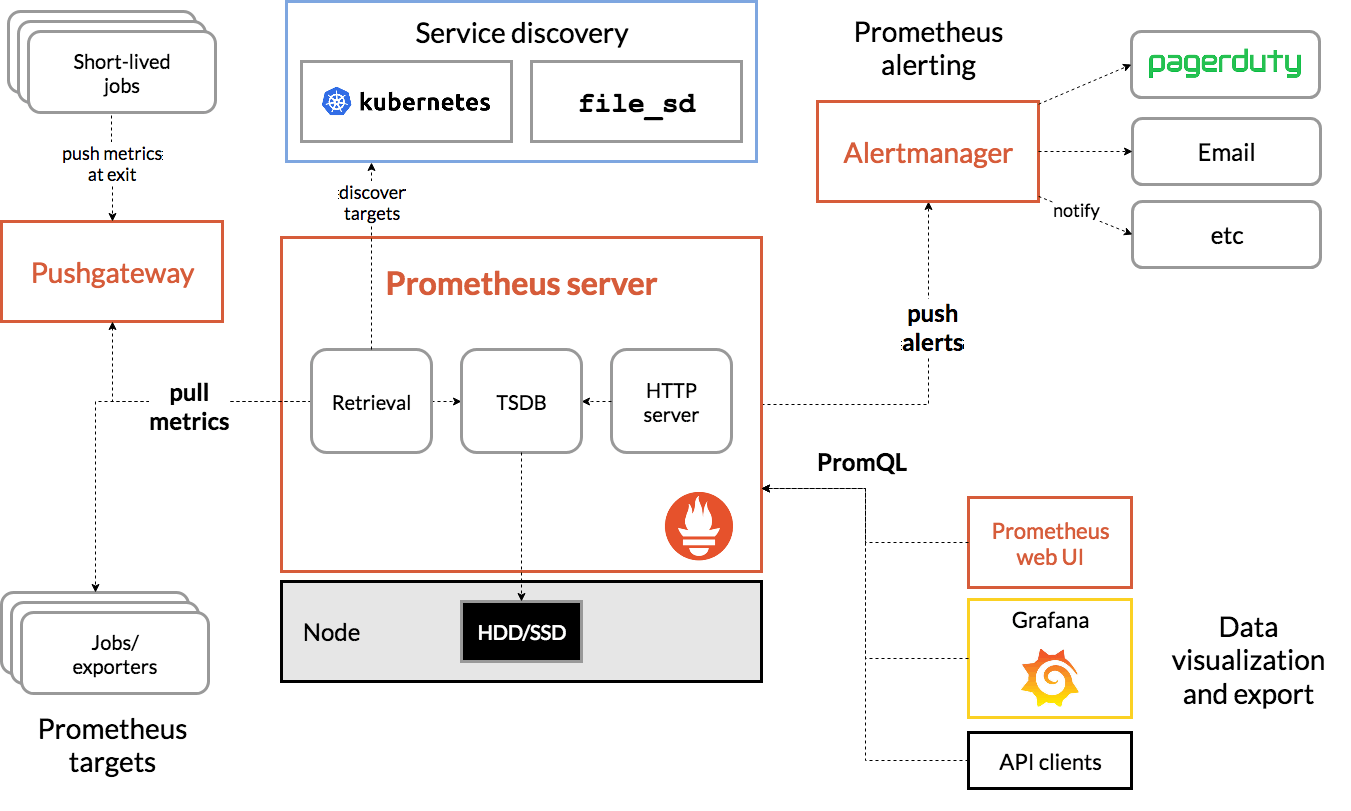
Image from prometheus.io
Components in Prometheus
These components are the Pushgateway, the alert manager, the server, targets, client libraries, and exporters. Each of these components has a specific way it contributes to Prometheus.
Pushgateway
Prometheus uses a pull model by nature, but there are some metrics that you cannot scrap using such a model. That is how Pushgateway came to be. Prometheus uses Pushgateway to preserve jobs with a short lifespan from terminating before it scraps them. Pushgateway acts as an intermediary, allowing Prometheus to scrape the metrics of those temporary jobs. One-time scripts and jobs run by a CI/CD are examples of these short-lived jobs.
Alert manager
Prometheus uses an alert manager to send alerts for errors spotted during monitoring. The alert manager sends these alerts to notification apps like email, Slack, and so on. The server generates these alerts, and so the alert manager groups them before sending them to the channel. It also mutes and suppresses alerts that are not needed.
Prometheus server
The server queries, collects, and stores time-series data. It uses a query language called PROMQL to access and process the stored data. It also generates alerts so the alert manager can work with them. The server uses a pull model to scrape metrics from their HTTP endpoints. It can also receive push-based metrics.
Targets
They are the endpoints of an application or hardware. Prometheus scrapes targets, which it stores in a time-series database. The data from the targets are used to create and track metrics and also generate alerts.
Client Libraries
Client Libraries format metrics in a way Prometheus could access them. You could manually set up a client library that uses the same language as your application. These client libraries have a set of APIs that are compatible with different programming languages. They provide metadata to Prometheus and set up functions to create and increment metrics. Prometheus has both official and non-official libraries.
Exporters
Exporters are third-party tools that send metrics to the Prometheus server. When Prometheus cannot access metrics, it uses exporters. These exporters export metrics from systems and send the metrics to the Prometheus server. There are official and non-official exporters in Prometheus' GitHub organization.
Comparison of Prometheus
There are other alternatives, like Prometheus, that have similar or different features. Some of the popular ones are Grafana, InfluxDB, and New Relic.
Prometheus vs Grafana
Prometheus and Grafana are both free, open-source monitoring systems used to monitor, record data, and analyse the performance of an application.
They have a large community of developers contributing to the application.
| Prometheus | Grafana |
| It was built by Sound Cloud in 2012 and donated to Cloud Native Computing Foundation (CNCF) in 2016 | It was built in 2014 by the founders of Grafana Labs. |
| It is a metric-based application and a data-collection tool | It is a data visualization tool. |
| You would need to add the data sources to a Kubernetes cluster. | Easily integrates data sources like Amazon CloudWatch, Azure Monitor, InfluxDB and so on. |
| Prometheus collects and stores scraped data. | Grafana creates a visual representation of metrics. |
| It has a query language, PromQL, which it uses to make queries and send alerts depending on the outcomes of such queries. | It provides support to develop dashboards you could share and set alerts based on the data. |
| Poor visualization interface to display data. | Rich interface for visualization. Including tools for customizable visualization as you desire. |
Prometheus vs InfluxDB
Prometheus and InfluxDB are both open-source projects with a large developer community.
Both have their query languages. They are both monitoring and time-series databases. They support the integration of other tools.
Prometheus is more popular than InfluxDB as it has higher GitHub stats and more companies and developers use it.
| Prometheus | InfluxDB |
| It has a query language called PromQL. Which is flexible and easy to use. | It has a query language called InfluxDB that is like SQL. |
| It is free unless you are using distros hosted on cloud providers. | Has both free and paid packages. |
| The server is independent. | Distributed server. |
| Uses an alert manager to make alerts. | Has a TICK stack comprising Telegraf (data collector), InfluxDB, Chronograf(visualization) and Kapacitor(alert manager). |
Prometheus vs New Relic
Prometheus and New Relic are both monitoring tools.
New Relic is more popular than Prometheus because a larger number of companies and developers use it.
| Prometheus | New Relic |
| Has a query language. | Does not have a query language. |
| Rated on stack share community as "powerful easy to use monitoring". | Rated on stack share community as "easy to setup". |
| Uses a pull model to collect metrics. | Uses a push model to collect data. |
| Prometheus is specialized in monitoring and the collection of metrics. | New Relic serves as an observability tool for applications and infrastructures. |
| Prometheus is a monitoring platform. | New Relic is a software-as-a-service. |
Conclusion
Many companies use Prometheus for monitoring although they may integrate other applications into it. Other applications like New Relic or Grafana but Prometheus still remains the No.1 solution for monitoring in applications.
Now you know what Prometheus does and how it works. For more information on how to set up Prometheus, check the official documentation.